| Representing numbers on a straight line. | |
| First two years of secondary education. | |
| Representing whole numbers. | ||
|
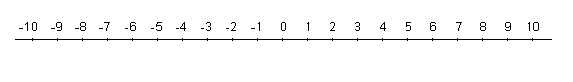
Whole numbers can be represented on a straight line in the following way: - Choose any point on the line and give it the value 0. - Choose another point on the line anywhere to the right of 0 and give it the value 1. The distance between these two points is now the unit of length. If you measure this unit of length from 1 to the right you get the next point, 2. Do the same thing again from 2 to get 3 and so on through the positive whole numbers: 1,2,3,4,5,6 etc. - If you measure the same unit of length from 0 to the left you get the negative whole numbers -1, -2, -3, -4, -5, -6 etc.
| ||
|
1. Some whole numbers are represented in the following window and point P is indicated in red. Which number does it represent? Write the number in the lower part of the window. If you have guessed correctly the number will appear in green. If not, the red point P will turn grey. Try it until you get three numbers correct in a row. Then, reduce the scale and carry on playing until you reach the minimum value of the scale, which is 10.
| ||
|
| ||
| Ordering numbers. | ||
|
One number is bigger than another if it appears further to the right on the line; e.g. 4 is bigger than 1 (expressed as 4 > 1). A number that appears further to the left on the line is smaller; e.g. 2 is smaller than 5 (expressed as 2 < 5).
| ||
|
2. In the following window a random pair of numbers will appear on the line. Relate these two numbers together using the correct symbol; < (less than) or = (equal to) and write the relation in your notebook. E.g. if the numbers are -2 and 3 you would write: -2 < 3 | ||
|
| ||
| Representing decimals. | ||
|
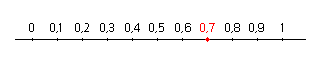
In order to represent the
decimal number 0.7 we need to know that if falls between 0 and 1. Then, we have
to divide the unit of measurement into 10 equal parts. We get to 0.7 by counting
7 of these divisions to the right, starting from 0, as 0.7 is a positive number.
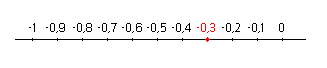
The number -0.3 falls between 0 and -1 so this time we need
to divide the line between 0 and -1 into 10 equal parts. Then, we count three of
these divisions to the left starting from 0.
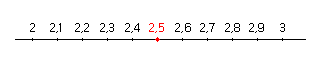
In order to represent the number 2.5, which falls between 2
and 3, we need to divide the line between 2 and 3 into ten equal parts. Then, we
count 5 of these divisions to the right starting from 2.
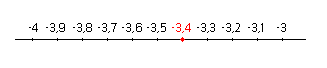
In order to represent the number -3.4, which falls between -3
and -4, we need to divide the section between -4 and -3 into 10 equal parts and
count four of these divisions to the left starting from -3.
| ||
|
3. Play the game that you did at the start of this unit again but this time with decimal numbers between 0 and 1. | ||
|
| ||
| Fernando Arias Fernández-Pérez | ||
| Spanish Ministry of Education. Year 2001 | ||

Except where otherwise noted, this work is licensed under a Creative Common License